Free printable · Spring frost
Fruit Blossom Frost Chart
How much cold the blossoms of 7 fruit trees take at full bloom, side by side on one page.
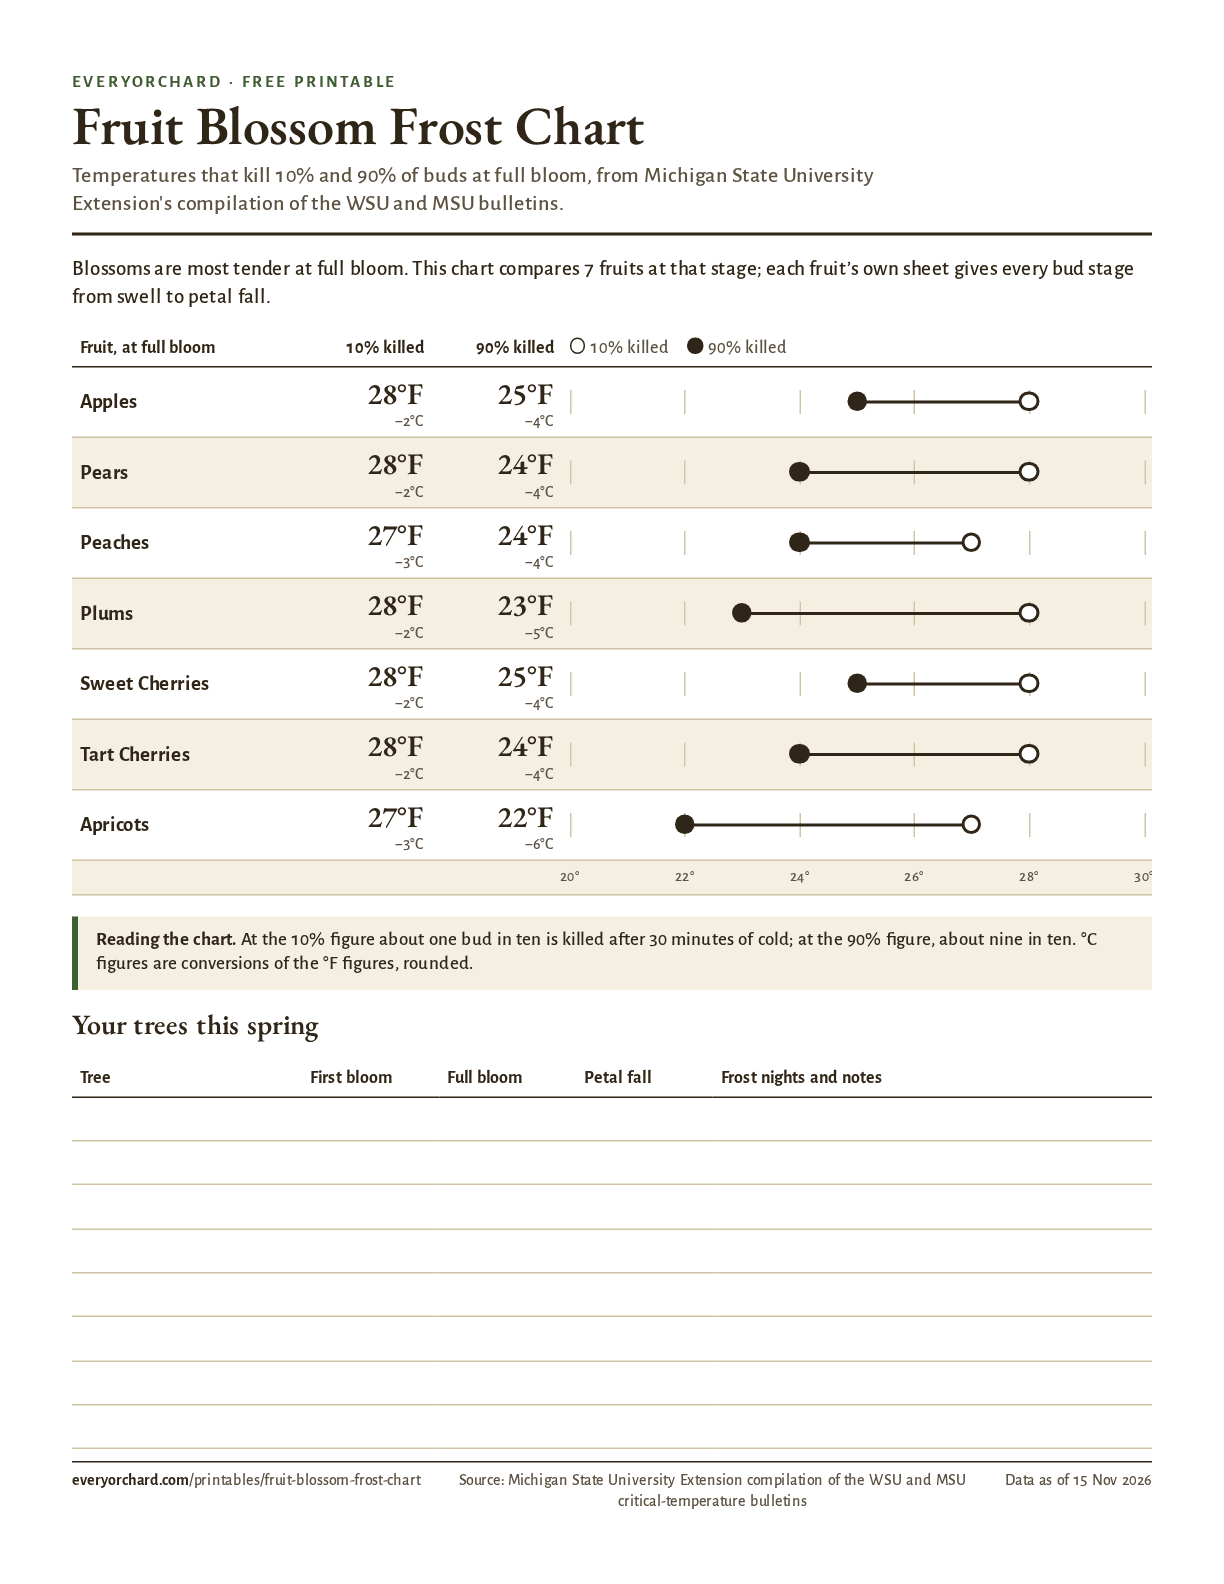
One page that compares every fruit the site has a bud-stage table for, at full bloom, when blossoms are most tender. Pin it up in the shed and check it against the forecast while your trees are flowering.
Download the PDF(PDF, 66 KB)US Letter, 1 page. Free, no sign-up.
What’s on the sheet
| Fruit, at full bloom | 10% killed | 90% killed |
|---|---|---|
| Apples | 28°F | 25°F |
| Pears | 28°F | 24°F |
| Peaches | 27°F | 24°F |
| Plums | 28°F | 23°F |
| Sweet Cherries | 28°F | 25°F |
| Tart Cherries | 28°F | 24°F |
| Apricots | 27°F | 22°F |
Figures as of November 15, 2026, the same data the site’s fruit pages show.
Use it with
Sources
Every figure on this printable comes from these sources.
- [1] Michigan State University Extension. Critical Spring Temperatures for Tree Fruit Bud Development Stages (compiled from WSU EB0913/EB0978/EB1128/EB0914/EB1240 and MSU research) — accessed July 2026